You’ve Got (Too Much) Mail: Behind the Scenes of the 3/25/26 Voice Outage
Discord Engineering
April 29, 2026
This article is a collaborative piece by Bo Ingram, Senior Staff Engineer on Realtime Infrastructure, and Stephen Birarda, Senior Staff Engineer on Audio/Video infrastructure.
The sad trombone haunts our dreams. Womp, womp, womp, woOoOoOoOmp. Womp, womp, womp, woOoOoOoOmp. Womp, womp, womp, woOoOoOoOmp. A cascading outage manifests in many ways: processes crashing, users reconnecting. As an on-call engineer, you often see it firsthand when the alert notifications reach your phone.
On March 25th, voice and video on Discord suffered major degradation beginning at 12:13 PDT until 15:30 PDT. During this time, users were mostly unable to start or join calls, seeing an “Awaiting Endpoint” message in their call status.
As part of a routine infrastructure change, a configuration update accidentally caused a large portion of Discord’s session management servers to shut down simultaneously. Sessions are the heartbeat of Discord’s real-time infrastructure — every connected device maintains one, and they coordinate nearly everything you see and hear in the app. Losing 17% of them at once sent a cascade of impacts through several downstream systems, ultimately overwhelming a service responsible for routing voice and video calls to the right servers around the world.
Since the incident, we’ve taken time to analyze our systems, understand why they degraded in the face of the cascading load from our session outage, and determine how we can leverage our experience from the outage to level up our infrastructure. In a distributed system, sudden load is a dangerous proposition. It hurtles through old bottlenecks and seeks out new ones. In this post, we’ll peek behind the curtain and see how one seemingly innocuous change overwhelmed a system multiple hops away and how our not-fun afternoon helped us improve Discord.
The Buildup
Our Realtime Infrastructure team is in the midst of a Kubernetes migration for our Elixir services. It’s the blessed path for deploying services at Discord, and we’ve been gradually shifting our existing services to fit this model and join in the compounding leverage of all we’ve built for this platform.
The stateful Elixir systems at Discord power much of our backend. Each host runs thousands of in-memory stateful processes that drive critical features like servers (from this point, we’ll refer to servers by their internal name: “guilds”), presence, and calls. When we need to take a host offline, we must ensure that all processes running on that host have handed off their data to another node to avoid any interruption. To verify this property, our deployments monitor an entity count on each server and only terminate the pod or stop the server when this monitor reaches zero.
Before the incident, we were wrapping up the migration of our session management service. Our sessions service manages users’ sessions (we picked a good name); each device you’re connected on gets a session process in our cluster. If you’re connected to Discord on both web and desktop, you’ll have two sessions. If you somehow manage to get Discord running on your smart fridge, you’ll have a session for that too. All chat messages, all presence updates, anything we push to the client over the websocket, goes through your session. It’s very important!
We’d noticed that CPU utilization was running hotter than we’d like over the weekends, and therefore we planned to tune the cluster to lower this metric. We decided to vertically scale our pods by increasing their CPU and memory while lowering the overall pod count proportionally, that way we can test and see if the higher scheduler utilization was a fixed overhead per pod or something that scaled with the number of sessions.
We prepared a PR to change the resources and pod counts and began deploying it.
Dropping Sessions
These changes were deployed to our first zone at 12:13 PDT. As Kubernetes applied our changes, it terminated 50% of the pods due to our decreased replica count. As a backstop, the service attempts to handoff its processes upon receiving a signal from Kubernetes, but a safety check designed to wait for other events in progress to complete meant the termination grace period in Kubernetes elapsed before handoffs could begin. Since the sessions service runs in three equally balanced zones, 17% of sessions across Discord were ungracefully stopped.
Our Elixir systems are powered by GenServer processes, a generic server process in Elixir. Across all of our services, there are millions of these processes running at any given time. If you’re familiar with the actor model of computing, you can think of these processes as actors. They operate by pulling a single message from their process mailbox: a queue of incoming messages. Then, they perform any necessary actions based on the message’s contents. Critically, each instance of a GenServer only processes a single message at a time; this single-threaded behavior lets us dodge some gnarly concurrency challenges.
A key building block in our realtime Elixir systems is the process monitor. By calling Process.monitor (or our more scalable ZenMonitor), we can guarantee that when a given Elixir process exits for any reason, the calling process receives a message ({:DOWN, …}) in its mailbox. If you turn off your desktop for the night and close Discord, your guilds’ processes will all receive a message that your session has exited. Your guilds then stop trying to send you messages, presence updates, and everything else until you log back on and start a new session.
Stopping 17% of sessions at once activated the monitors for each of those sessions, sending a flurry of messages throughout the realtime systems — one message per session for each entity monitoring it. We see the first effects of these messages in our gateway service, as it drives the disconnected users to reconnect.
Reconnecting Users
The next stop in our incident is our gateway service, which serves as both the ingress and egress point for all websocket traffic. When your client starts, it connects to the gateway and receives all the servers, channels, DMs, profile pics you need to make Discord be Discord by reaching out to the sessions service to create a session. It holds the socket open, dispatching messages to your client.
A surprise session exit isn’t unanticipated. Degraded hardware in a cloud provider, network errors, self-introduced bugs, or you’re using Discord on a train in a tunnel — there are myriad reasons a session might disconnect. To recover, our gateway service monitors each user’s session and immediately tells the client to reconnect if there’s an issue. We then optimistically attempt to resume the users’ session by reconnecting to an instance of the gateway service in the same zone as the user’s session. If the session’s still there, great! We hook everything back up, and you can continue discussing stealing brainrots. If not, then we go ahead and start a new session for you.
At 12:13 PDT, this resumption happens not for one session, but for 17% of our total sessions. Because all of the affected sessions were running in the us-east1-b zone, they mostly have their gateway connections co-located in us-east1-b. Each gateway process for each affected user gets a :DOWN message, signaling to the client that their session is now invalid and requires a reconnection to our systems.
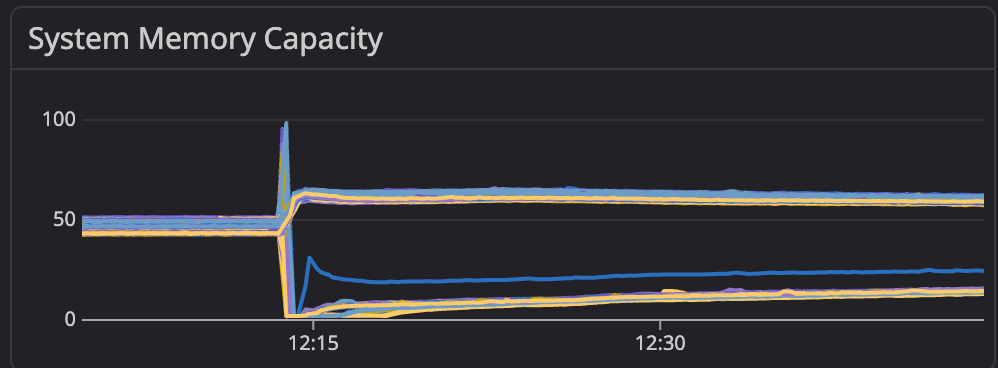
As these requests arrived, they triggered our start session rate limit that provides backpressure when we have a flood of requests… but that rate limit hadn’t yet been re-tuned after the migration. As we were running a higher pod count than the previous VM architecture, the per-host rate limit allowed more capacity through, increasing serialization from more concurrent session starts. Memory usage spiked on all of the gateway nodes in us-east1-b, and we began to run out of memory.
Gateway memory capacity: above, we can see the us-east1-b nodes spike and restart.
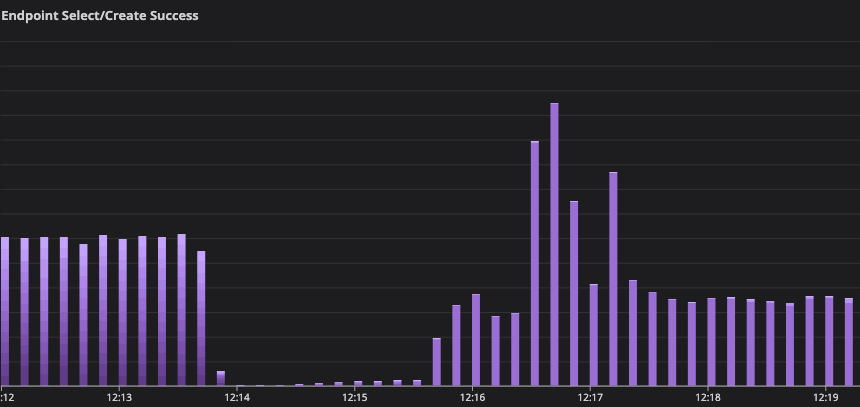
Gateway identifies over time: here, we can see the initial spike and then a long tail of reconnections.
This behavior terminated the gateway connections for the remainder of the users in us-east1-b, but as designed, their sessions were still alive. Our newly affected users and those with the terminated sessions then did another round of reconnects, failing over to the us-east1-c and d servers. Those who still had their sessions were hooked back up and immediately back online, while users without sessions were able to begin restarting their sessions.
The impact, however, wasn’t over yet. Concurrently with the gateway’s zonal memory exhaustion, users struggled to connect to voice chats. The reconnection of so many sessions eventually made its way to our A/V infrastructure, exposing a novel failure mode of the voice syncers service.
Overloading Voice Syncers
Every session connected to a call on Discord has a “voice state”: this tells some call-owning service, like discord_guilds or discord_calls, that your session wants to be connected to a specific guild’s voice channel or a DM/Group DM call. Voice state updates are forwarded from the call owning services to the voice syncers service. The voice syncers service evaluates active voice states to decide where to place and manage every active call, constantly sending RPC commands to our fleet of more than 25,000 external Selective Forwarding Unit (SFU) instances. The SFU proxies end-to-end-encrypted media between the participants of the call. If you and a friend are talking in California, it’s inefficient to host your call in Europe.
When the call owning service finds out your session has exited (shoutout again to process monitors), it creates a disconnecting voice state update that is sent to voice syncers, and the syncer process sends an RPC to tell the SFU that your session is disconnecting. When the last session disconnects from an active call, the syncer process sends a blocking stop RPC to the SFU before cleaning up its own state.
Many sessions disconnecting all at once causes many sessions to leave voice calls and causes many voice calls to empty out and be stopped. When the sessions reconnect and attempt to reconnect to the voice call, syncers dispatches RPCs to SFUs to recreate calls and connect sessions to those calls. The reconnection of many sessions necessarily creates a nice flood of outgoing HTTPS connections from the voice syncers service to our global SFU fleet.
Whenever voice syncers make an outbound HTTPS connection, it calls through an internal Discord library called Holster to pool connections from the gun library: an Erlang HTTP client. Unfortunately, as we discovered during this incident, this pooling means creating a new connection goes through two bottlenecking Erlang supervisor processes, one for anything using a Holster.Pool and another for all gun connections.
Each of these supervisors is a single GenServer process, and when they spawn a new child they perform a selective receive – scanning through their mailbox to look for a specific message – to wait for an ACK from the child process. In our postmortem testing, we confirmed that this selective receive on a supervisor with a ~100k mailbox queue adds ~1ms to process spawn time. With a sufficiently large mailbox and fast enough rate of new connections being spawned (such as a mailbox queue of 1M with 100/s spawn requests including 1ms spawn delay), catching up becomes impossible.
When the gun connection supervisor mailbox backs up, new connections are blocked because they cannot be opened within the connection timeout. As the Holster.Pool DynamicSupervisor backs up, both new and existing connections are blocked because checking a connection out of the pool cannot happen within the original request’s timeout.
Unfortunately for voice syncers, the etcd connection that powers our Elixir service discovery also goes through the bottlenecking supervisors. We assign processes to nodes based on their placement in a consistent hash ring powered by etcd, a distributed key-value store. A given instance reports its health periodically to etcd. This coupling means that refreshing the service registration can also be blocked by the supervisor mailbox growth, causing voice syncer instances to drop out of etcd once the 60s time-to-live expires.
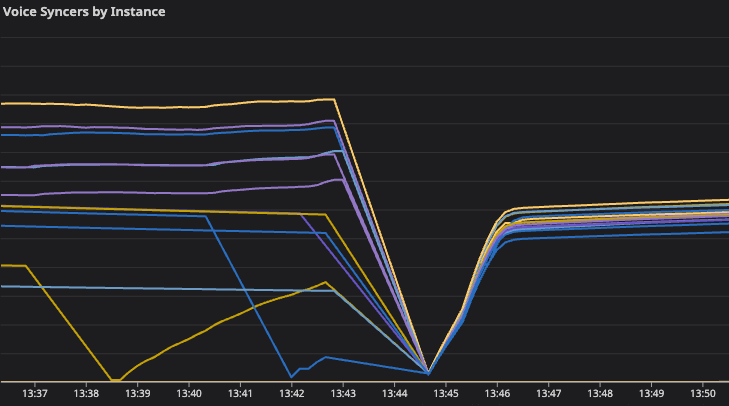
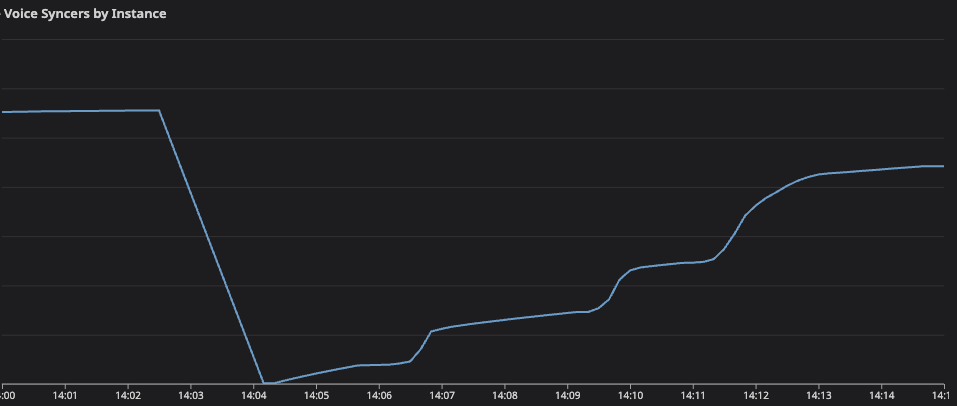
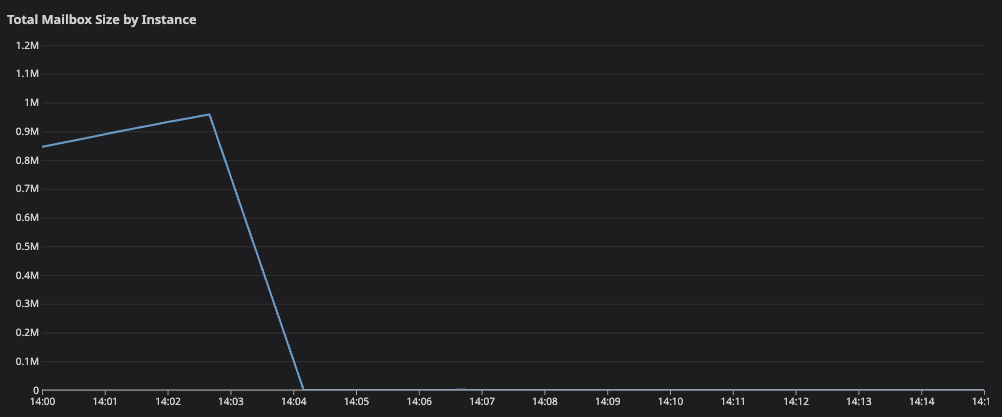
Impact to A/V services started at 12:13, when the aggregate process mailbox length on all of our 15 voice syncers started growing, causing RPCs to SFUs to plummet.
Since all of the hosts “dropped out” of the consistent hash ring, stopped taking on new syncers, and weren’t able to make any RPC requests, we can be reasonably certain that the Holster.Pool DynamicSupervisor was backed up on all of our instances.
To confirm this finding, we reached for Recon, an amazing tool for diagnosing issues in Elixir and Erlang production systems (the related Erlang in Anger is more-or-less required reading as all on-call engineers end up scouring its pages eventually). When we fired it up, we were able to take a snapshot of the running Erlang processes and sorted it by their mailbox queue length. Guess who was #1? Our friend, the Holster pool’s DynamicSupervisor.
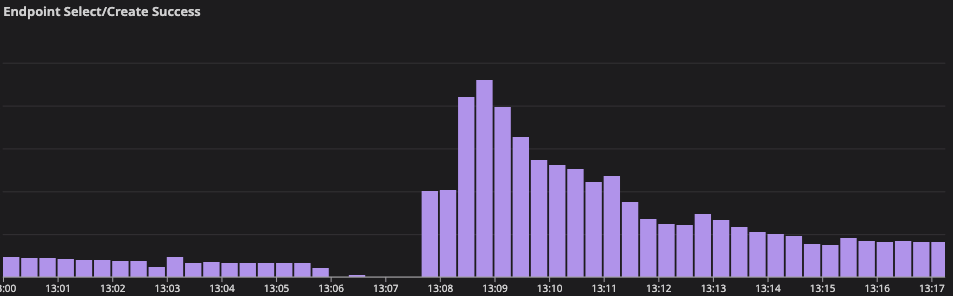
A single instance, 2-8, was lucky enough to catch back up, clear its mailbox, and re-announce in etcd. Our hash ring configuration means this solely healthy instance can handle a 3/15 share of the global syncer traffic, and each entity in our systems gets a primary, secondary, and tertiary instance. This lone survivor was the cause of the spike in endpoint selection and RPC creation success, but further intervention was required to restore service to all global traffic.
Hook, Line, & Syncer: Bringing Voice Back Online
By querying etcd, we could see that a majority of voice syncers instances were not announcing and were out of the hash ring. While these instances were not taking on new voice syncer processes, they still held most of their pre-impact voice syncer processes. Not wanting to impact ongoing calls we first attempted targeted recovery of individual instances.
At 12:43 we fully restarted the voice syncers application on instance 2-13. At 12:47 we killed and restarted the Holster.Pool DynamicSupervisor on 2-1 after the erlang recon module confirmed that its mailbox was getting backed up.
In both cases, the instances very briefly recovered — they were able to re-announce in etcd, quickly take on voice syncers, and dispatch some RPC messages to SFUs.
Because the majority of our instances were not in the ring, healthy instances were accepting additional traffic acting as the secondary and tertiary failover for unhealthy instances. Thanks to the oversized influx of new syncers (and in 2-1’s case, the pending retries for RPCs to existing voice syncers), mailboxes immediately started to grow again and we re-entered a similar failure mode.
With targeted instance recovery not working, we felt that maximizing the concurrent number of healthy instances would give us the best chance of recovery. At 13:05, we attempted a restart of the full voice syncers cluster. This “restarts the Discord” from the perspective of the A/V infrastructure, and quickly re-creates millions of active calls. The instances restarted and some initial RPC connections succeeded, moving some calls out of the “Awaiting Endpoint” state.
Once again, recovery was short-lived — the cold-start thundering herd was too much to handle, and by 13:09 all restarted nodes had ever-growing mailboxes again. There were split failure modes across the instances (depending on the Holster.Pool supervisor being backed up or not), but all instances were eventually unable to create new connections and needed further intervention.
It was clear we needed a way to slow down the influx of outgoing HTTP requests from restarted syncers instances. We attacked this from two parallel fronts: tuning our existing syncer creation rate limit and growing the syncers cluster.
We already had some rate limiting on call owner voice syncer creation, but discovered during our incident response that this was outdated or unset across the call owner services. This rate limit in guilds was especially ineffective, as it limits only the spawning of the “coordinator” voice syncer for each guild while allowing an unbounded spawning of child syncers for each of the guild’s voice channels (each of which will select at least one SFU endpoint they need to connect to).
Until A/V Infrastructure follows the Kubernetes migration path defined by the realtime infrastructure team, growing the voice syncers cluster is a somewhat manual (and unfortunately) slow process. Instances live on GCP VM nodes defined in Terraform, are configured by Salt, and need to be manually added as ring candidates in etcd.
The rate limit changes were ready first: by 13:43 the calls, streams, and guilds services had low syncer spawn limits in place and we attempted a restart of the voice syncers cluster again. This followed mostly the same pattern as the 13:09 restart — initial recovery followed by ever-growing mailboxes — but with one helpful difference: the backed up supervisor across instances was consistently the gun supervisor instead of Holster.Pool. This allowed instances to checkout pooled connections created before the gun supervisor got too far behind. All restarted instances stayed announced in etcd, retained their target voice syncers, and were also able to successfully send RPCs to SFUs for a subset of their syncers.
While we waited for Salt to finish provisioning the 15 new syncers instances, the slightly improved partial recovery from the 13:43 restart gave us the confidence to once again attempt targeted recovery of individual instances — an urgent game of whack-a-mole.
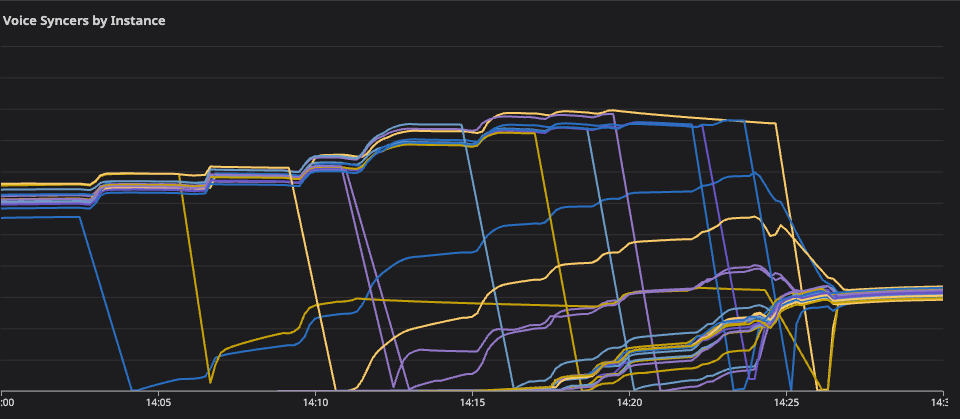
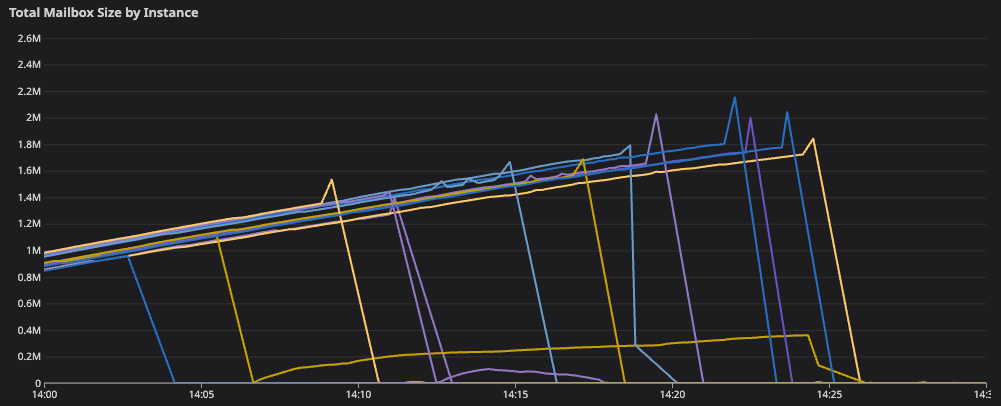
Some targeted restarts were finally successful, providing full recovery of some instances. At 14:03, we restarted the voice syncers application on instance 2-3. It happily took on its voice syncers, the aggregate mailbox length stayed low, and new and existing connections were consistently successful. We chalk this success up to a few factors: lower rate limits slowing the spawn rate of syncers, the number of global syncers being reduced being further off peak and due to the ongoing incident, and the healthier cluster needing fewer secondary and tertiary placements of syncers.
By 14:15, we had restarted 5 instances with 4 of the 5 successfully demonstrating a full recovery. At this time, the additional 15 instances doubling our capacity were also simultaneously brought online, successfully taking on syncers without any mailbox queuing issues. This operation halved the per-instance syncer count and improved the success rate of the final remaining restarts. By 14:26, the final backed up instance was restarted, and the doubled cluster was in a fully healthy state.
Making Improvements
Every incident gives you valuable insights into your systems; it's our responsibility as engineers to apply these learned lessons. After the SEV, we immediately investigated, held a postmortem, and applied several changes to our systems.
To start with the initial source of the outage, we've introduced a validating admissions webhook to our Kubernetes cluster for our Elixir workloads. Graceful draining of entities is key to Discord's uptime; we now assert that any given pod is drained before scaling back a workload. Instead of pods scaling down immediately, we reject the update until the pod has successfully handed off its processes. Our Kubernetes migration has been very successful thus far; we’ve greatly improved both the reliability and the hands-on time of our deployments. While we rarely scale down, asserting this property lets us work safely, and through our greater safety, work quickly.
Regardless of our safer scale-down behavior, the effects in our voice systems were too large. To limit these impacts in the future, we took a two-pronged approach to attacking the bottleneck in voice syncers. After running load tests, we've increased the throughput by replacing Holster.Pool's supervisor with a PartitionSupervisor, which lets us balance requests to the connection pools across multiple independent supervisors and create or checkout outgoing connections concurrently. This change helps prevent the contention we saw during the incident, where services were blocked from updating etcd by a deluge of upstream traffic. We’ve also moved the gun connection process lifecycle management to the Holster.Pool that spawns it, removing the need to use the gun connection supervisor at all.
Additionally, we've tuned the upstream rate limits that call into voice syncers, letting them kick in more accurately and optionally forcing their application with load shedding tooling to cause voice syncer recreation. We’ve added and tuned new rate limits for endpoint selection in voice syncers, providing another mechanism to limit outbound connection creation. By allowing for greater parallelism and lessening the inbound load into our voice systems during these incidents, we're better equipped to handle large load spikes.
In our internal postmortem, we asked not only how we could've avoided the issue, but once it happened, how we could have solved it faster. We've leveled up our observability game: preventing the incident is great, but improving time to resolution helps us recover faster in the future, even in unrelated situations. As part of our improvements above, we've added additional monitoring around the HTTP connection pooling mailboxes, giving us a stronger signal into when it's a problem and when it isn't. Our instrumentation and logging for service discovery announcement and voice syncer to SFU RPC traffic have been exhaustively reviewed and expanded, giving a more complete picture of the voice syncer’s responsibilities.
Looking ahead, we don’t want to solve this same problem in each service. Following in the spirit of GenServers (a generic server), we want to think more generically about Elixir monitoring. Instead of looking at aggregate proxy metrics like overall mailbox health, we’re continuing these investments and expanding monitoring of our most critical processes across all of our services. As we continue genericizing, we’ll be bringing more of our workloads into Kubernetes. Instead of manually provisioning VMs, it will be much more efficient to scale Kubernetes pods with a single command.
The A/V infrastructure team is already hard at work on a large re-architecture of our system, including some long-term improvements to some of the issues we identified during this incident. By horizontally scaling our control plane services across multiple regions, we’ll gain reliability, regional fault tolerance, and spread outgoing connection spikes more smoothly around the world.
Guided by Constraints
Our pain doesn’t have to be solely our gain. Observing an incident in production when it isn’t your system is a win/win: you don’t have to undergo an outage, but you can still leverage the lessons learned.
A sufficiently large traffic spike will find a bottleneck in your system. You may know where it will be, you may have an idea, or you may find a completely novel degraded state. In previous large-load incidents, the bottlenecks have historically been our various ScyllaDB databases limiting recovery. We took on a project last year to add the capability to automatically surgically reduce demand in our API when overloaded through circuit breaking. In this incident, our databases performed admirably; the bottleneck shifted to our voice services.
When you encounter this capacity constraint, you have an economics problem: your solutions either increase supply (adding additional services) or reduce demand (rate limiting inbound traffic). We try to explicitly ask ourselves this question when we find a capacity constraint – how can we increase supply or reduce demand. This question guides our incident response and our postmortem action items.
It’s also important during incidents to know your toolbox. Elixir and the BEAM Virtual Machine give engineers a ton of introspection options; you can pull any process’s state or even hotpatch it to add additional observability. During the incident, we even did a targeted restart of only the Holster pool’s supervisor on a specific node (it didn’t help). The visibility Elixir gives us into each process mailbox unlocked more granular observability for us moving forward.
Lastly, when working with distributed systems, you must consider the failure modes of your system. Because of Elixir’s single-threaded-message-passing-ness, we’re mindful that any degradation in the “hot loop” of a process can degrade not only the service but the user experience. This awareness guides the design of our systems, and incidents where we violate that principle have clear areas for improvement. Whether it’s rate limiting, dropping inbound messages, aggressive timeouts, or even disallowing synchronous calls in our busiest processes, this failure mode is top of mind, and our tooling helps aid recovery (the upstream semaphores) even if it’s not able to directly influence the issue.
Chatting with friends and teammates is core to Discord, and when that isn’t working, we’re thinking from the moment the sad trombone hits about how we can improve our reliability.


![Line chart for “Voice Syncers by Instance.” [CONT]](https://cdn.prod.website-files.com/5f9072399b2640f14d6a2bf4/69f242d517985c12f3ec76c6_ee26d65d.png)


.png)
.png)


Nameplates_BlogBanner_AB_FINAL_V1.png)

_Blog_Banner_Static_Final_1800x720.png)


_MKT_01_Blog%20Banner_Full.jpg)


.png)


