


Discord's API is powered by a unified Python codebase containing over 1700 API endpoints and around 700 background tasks. Engineers make changes to this shared code every day as it's continuously deployed to several hundred separate Kubernetes deployments through a phased rollout process.
That is a lot of code, engineers, endpoints, and deployments! It can be challenging to keep track of all of the changes made every single day, but we have good instrumentation that allows us to keep an eye on latency, throughput, and error rates to help detect regressions that may negatively impact users or our systems.
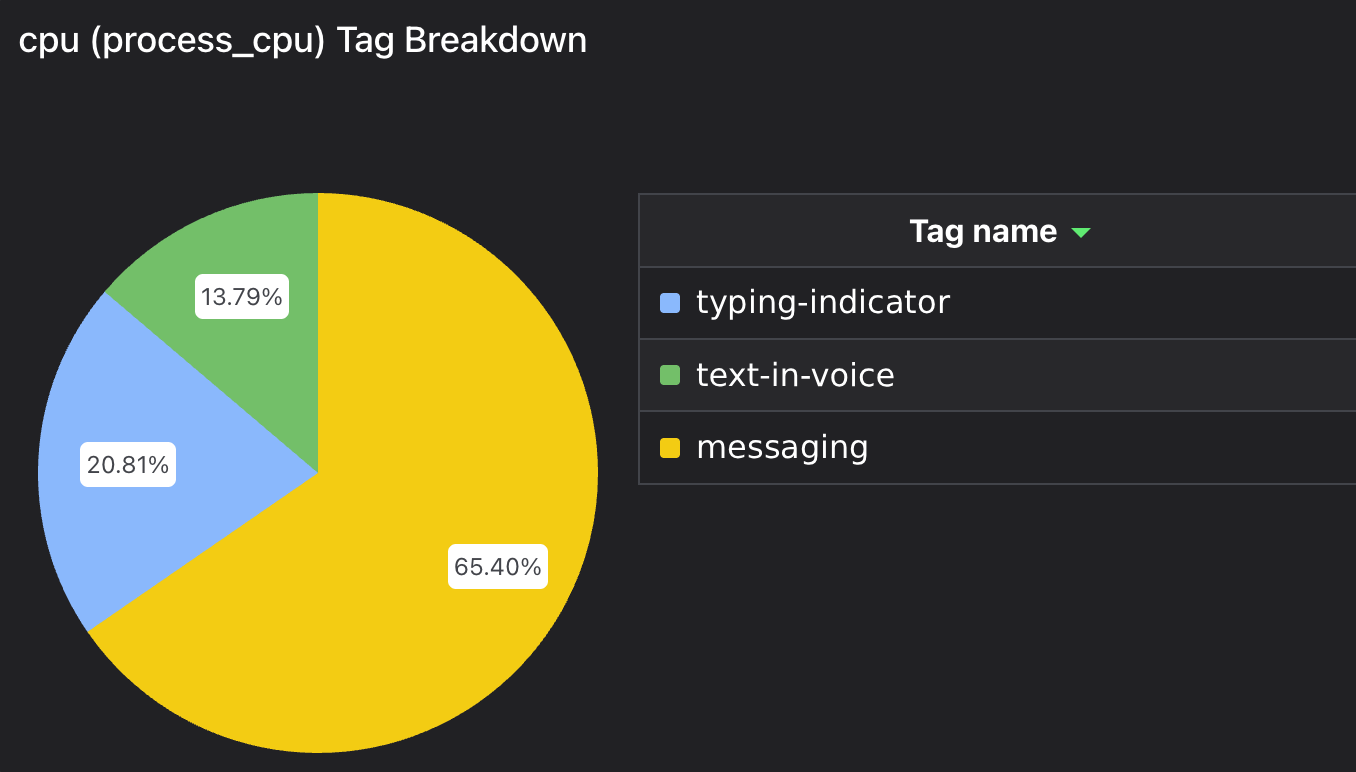
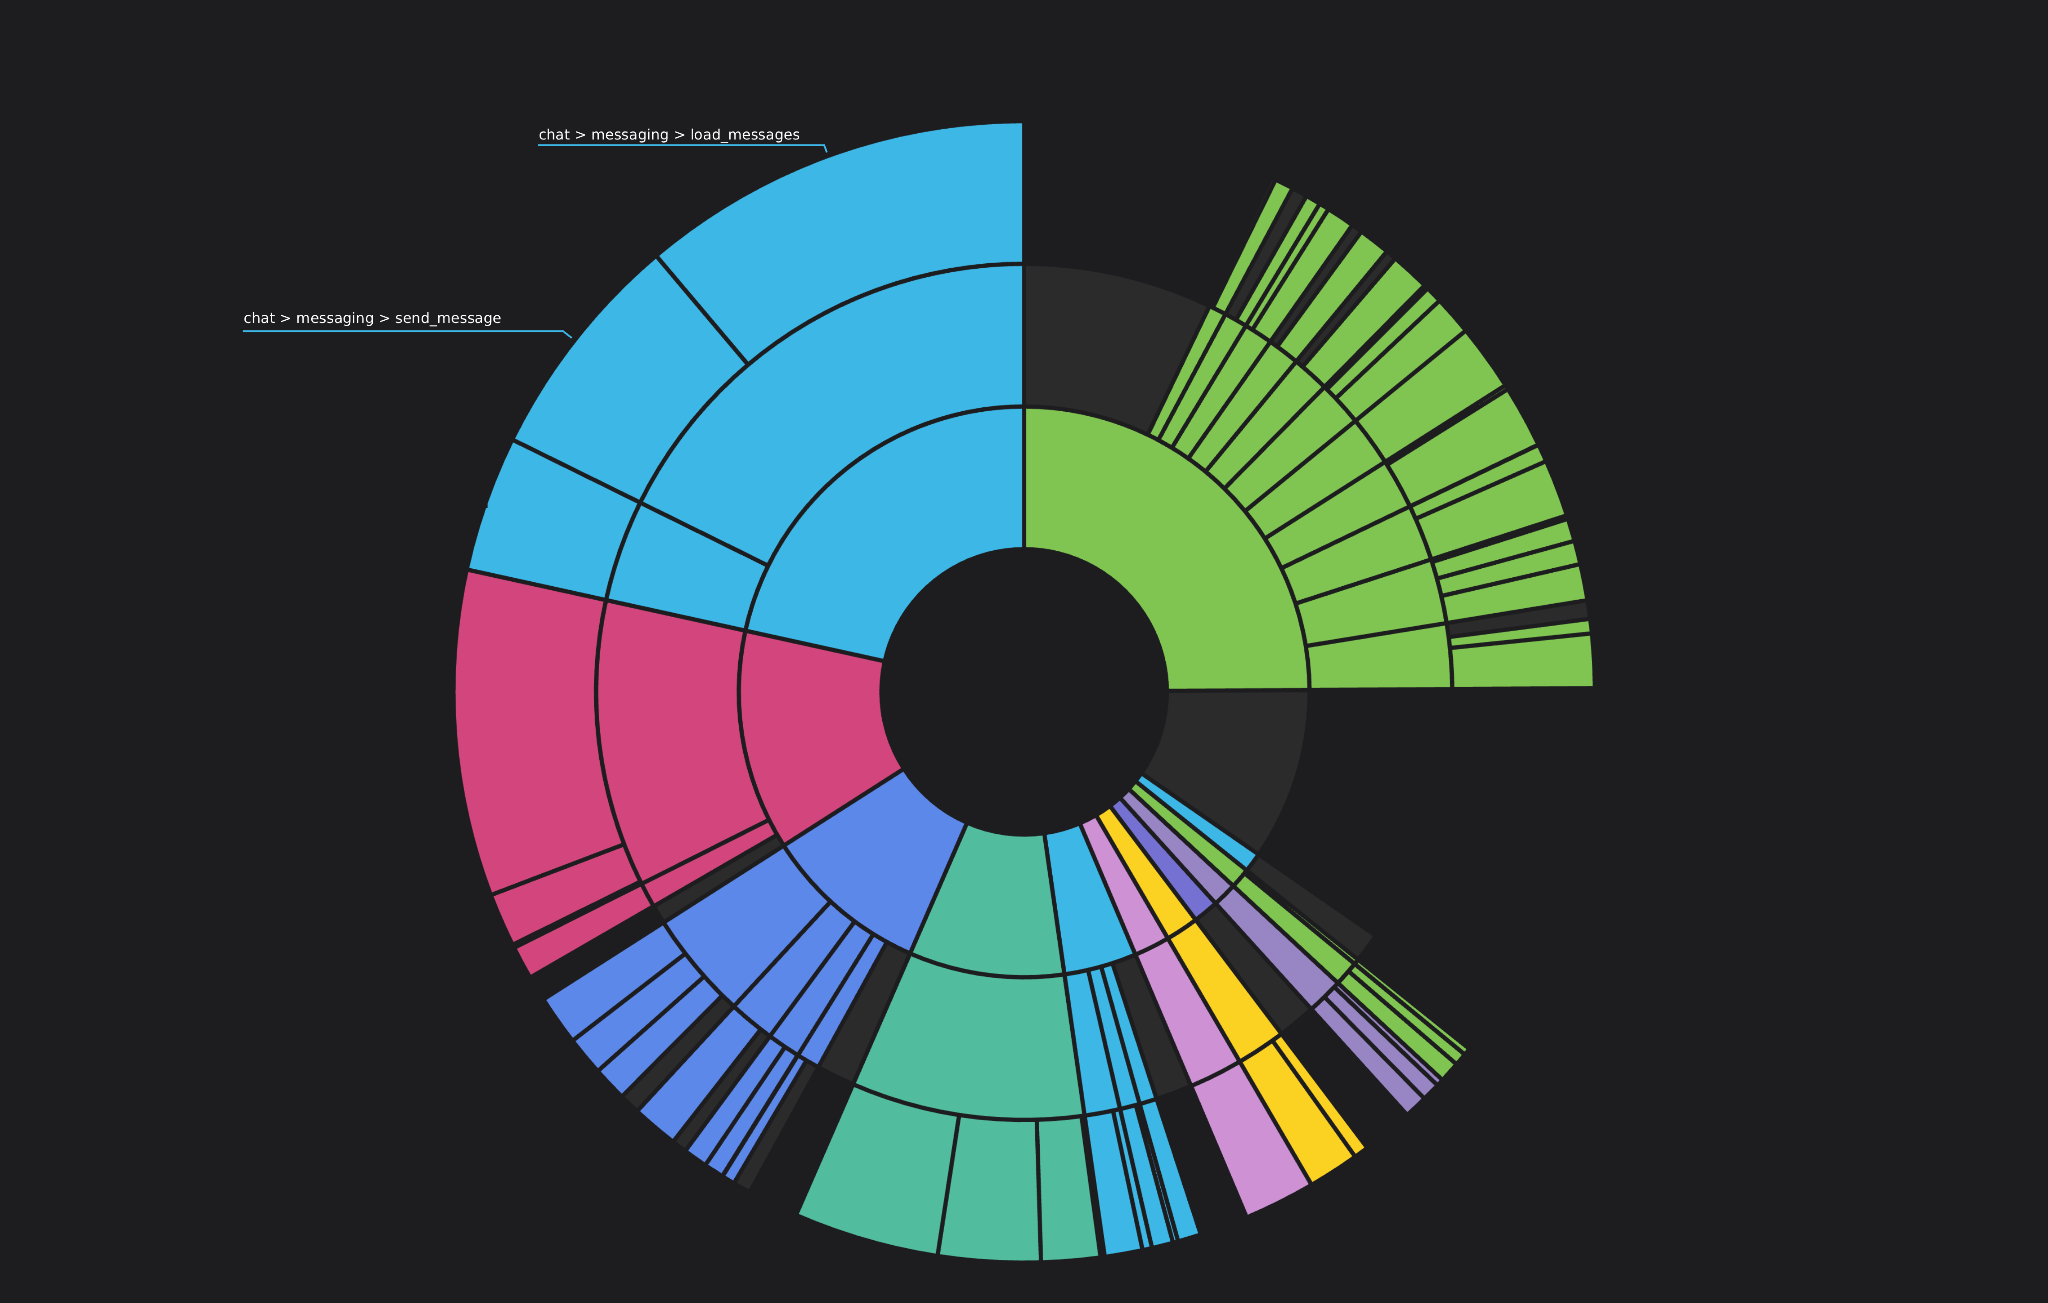
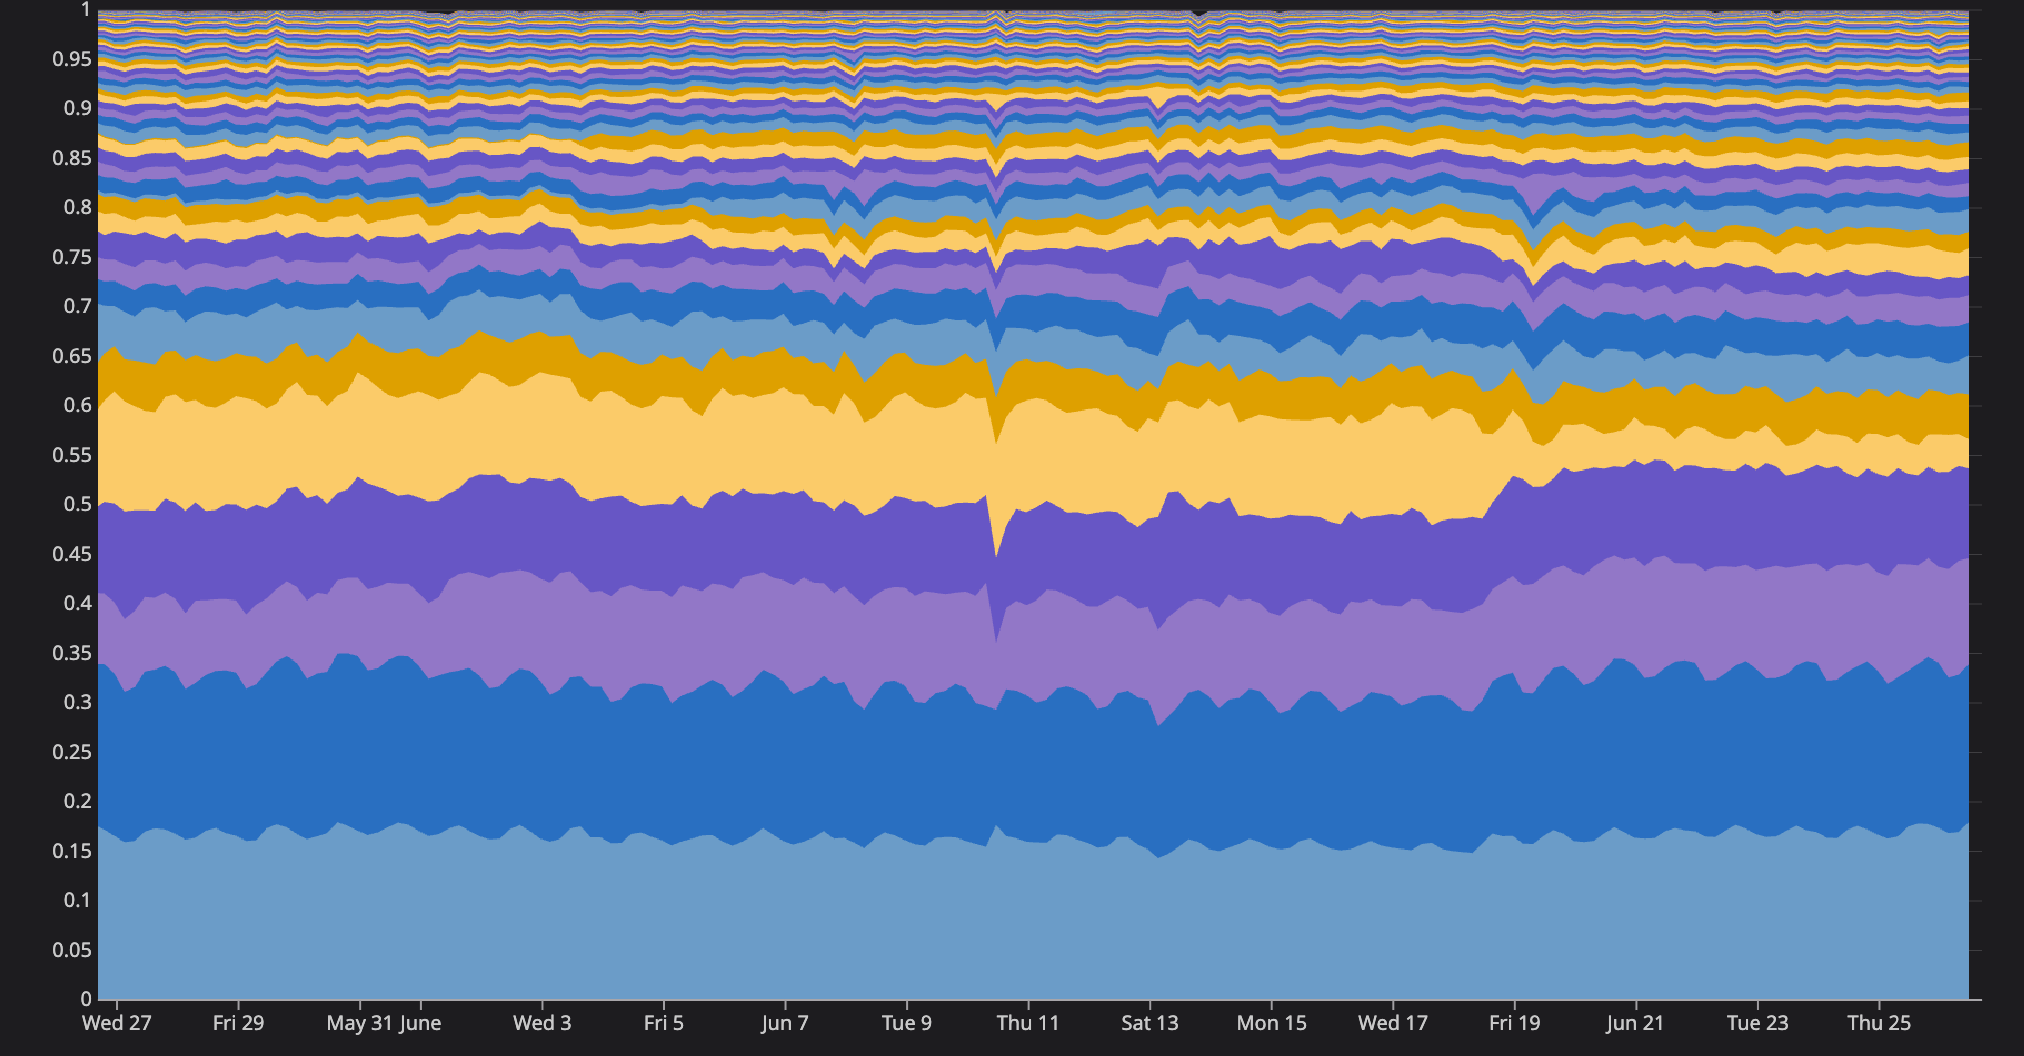
One observability gap that we wanted to improve last year was our understanding of how hosting costs were allocated across product features. For example, how much does it cost to operate the parts of API that are used to send and receive messages? Start a stream? Send a friend a Nitro gift? How do these values change over time? Did that change someone landed last week meaningfully affect a team’s spend on hosting? We’d like to know these answers for both a single endpoint (e.g. sending a message in a text channel) and for an entire feature (e.g. chat - more on these later).
Most cloud providers will happily split out your costs by Kubernetes deployment, which is helpful but is only the first step due to how we deploy the API. We run the same codebase in all of our Kubernetes deployments, each of which handles a specific subset of HTTP traffic or background tasks. Since we already have so many deployments, breaking them up further to facilitate cost tracking isn’t tenable. We needed to find a way to add better tracking to our existing system without changing our deployment topology.
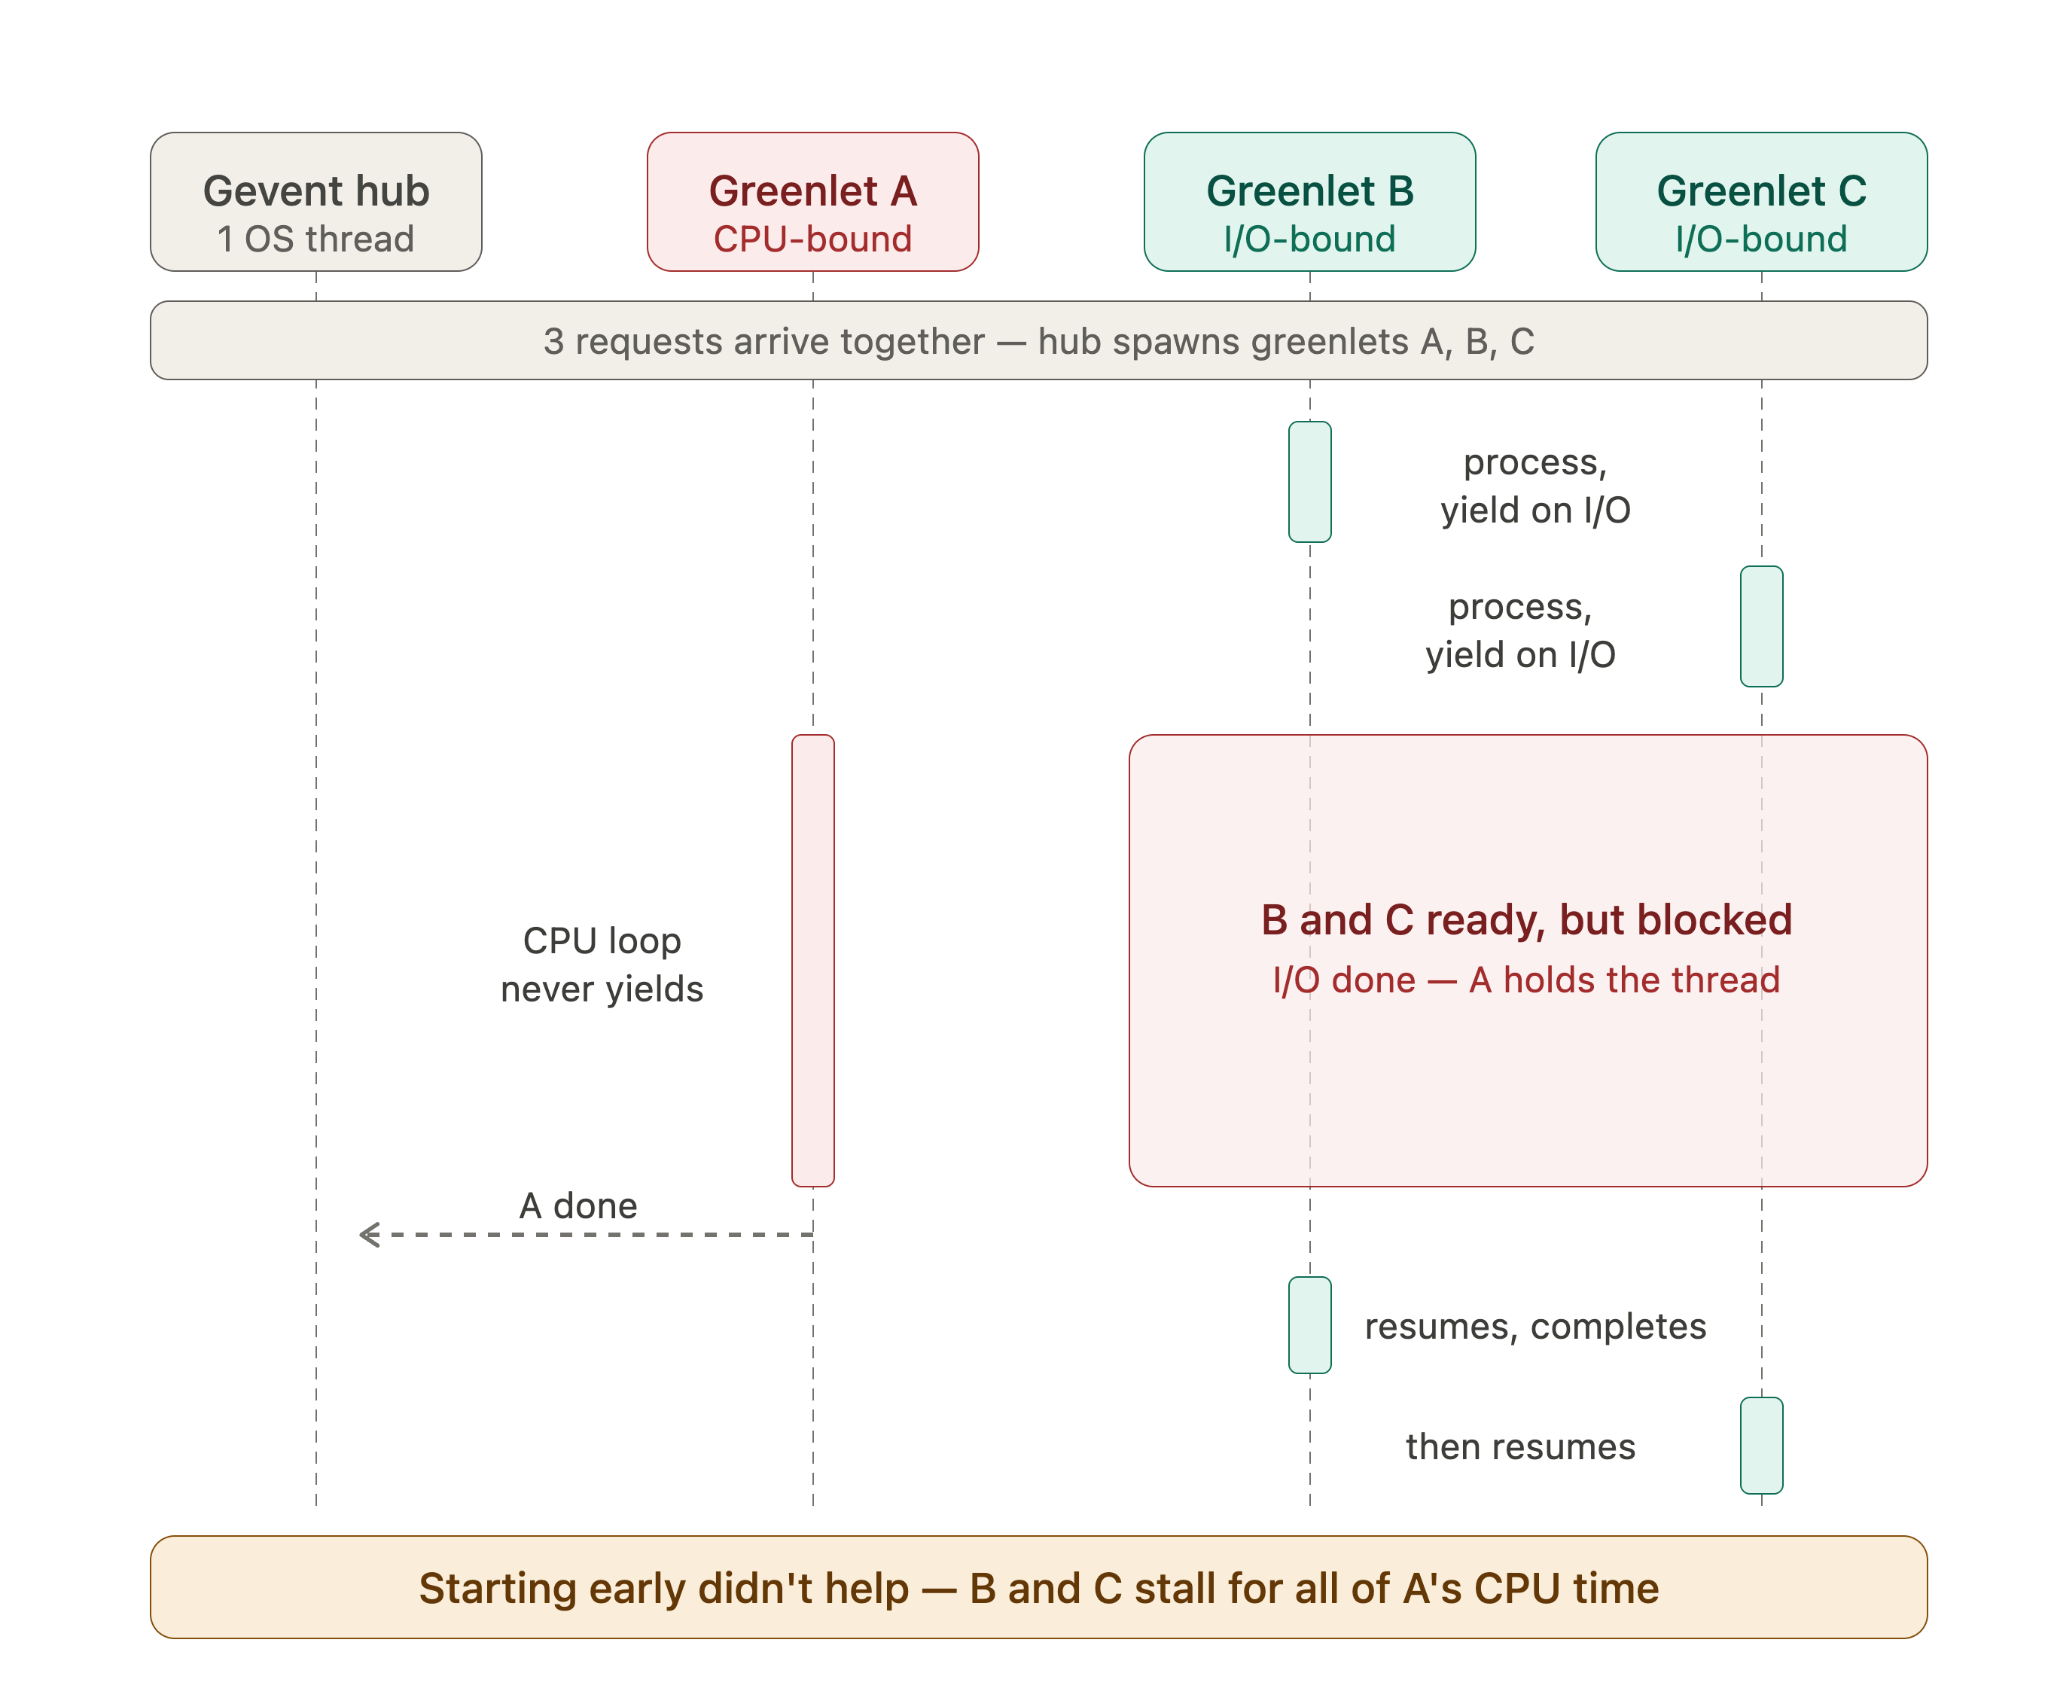
An additional challenge is that each API worker process handles multiple tasks concurrently. At any moment, it will be juggling work related to any number of features (we do isolate certain traffic to particular deployments, but not in a way that helps us here). Ultimately, in order to understand the cost of serving the API traffic related to a given feature, we need to be able to allocate the cost for a deployment based on how much time it spent on code related to that feature. By extending our application’s profiling tooling, we were able to do exactly this.
Note: all numbers and code in this post are for illustrative purposes only.


.png)
.png)


Nameplates_BlogBanner_AB_FINAL_V1.png)

_Blog_Banner_Static_Final_1800x720.png)


_MKT_01_Blog%20Banner_Full.jpg)


.png)


